


12
Jul
2026
Bitcoin (HODL) Three Waves Reversal: Catching the Turn Before the Crowd
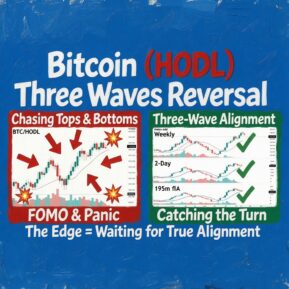
Bitcoin moves fast, talks loud, and has a habit of making everyone look like a genius right before it reminds them they’re not.
READ MORE10
Jul
2026
The Numbers Don’t Lie — Your Luxury Watch “Investment” Is Mostly Hype, Haircuts & Hope
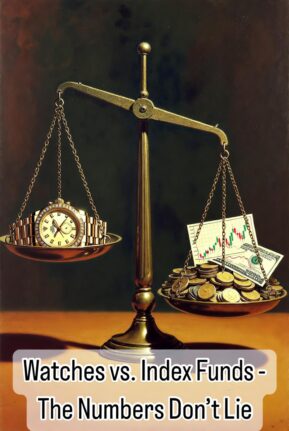
https://youtu.be/EOQVW1wWE3A They sold you the dream in stainless steel. Buy the right watch and it appreciates while you wear it. A Submariner as a store of value. A Daytona as a pension with a tachymeter. The marketing was elegant. The numbers are not. Your “investment” is a steel box that loses time worse than a…
READ MORE6
Jul
2026
Your Rolex Is Not an Investment. It’s a Very Expensive Way to Tell People You Have Money
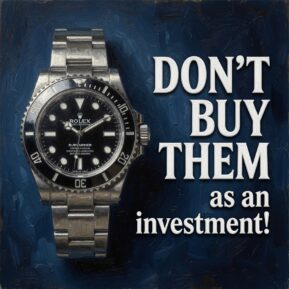
Every dollar tied up in a watch is a dollar not compounding in a low-cost index fund. No dividends. No automatic reinvestment. No quiet growth while you do something useful with your life. Just opportunity cost with a date window.
READ MORE21
May
2026
The VIX: Wall Street’s Official Fear Thermometer That Retail Traders Pretend Doesn’t Exist
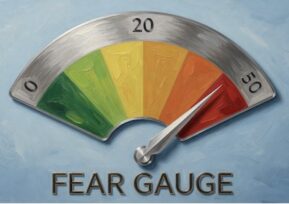
Most traders wake up, check their favorite stock, maybe glance at futures, and start placing bets like it’s a coin flip with extra steps. The professionals? They check one number first — the VIX. The market’s official, real-time anxiety meter. And yes, it actually works. The VIX (CBOE Volatility Index), affectionately known as the “Fear…
READ MORE2
Feb
2026
From Parabolic Surge to Historic Crash: Unraveling the 2025–2026 Precious Metals Meltdown

The 2025–2026 meltdown was neither purely organic nor purely engineered. It was the inevitable collision of real stress, speculative mania, and fragile market structure—an explosive reminder that when trust in money erodes, price discovery becomes a contact sport.
READ MORE19
Sep
2025
Unveiling Investor Psychology: Volume Price Analysis Through the Lens of Heiken Ashi Candlesticks

In the dynamic world of financial markets, understanding investor psychology is akin to peering behind the curtain of human emotion and institutional strategy.
READ MORE23
Feb
2025
Places to Park Cash, For Your Consideration…

Want to learn stock trading or investing? We urge you to “Follow the charts, NOT the noise!” and improve your knowledge of stock, ETF and Bitcoin movements.
READ MORE8
Sep
2024
6
Sep
2024
Riding the Waves of Success: The Three Waves Trading Technique

The Three Waves Trading (TWT) Technique is our dynamic trading method that harnesses the power of three time frames: weekly, two-day, and 195-minute (half-day) charts.
READ MORETalk about Daily Review
Connect With Us
Talk about Weekly Review & Forecast

